
Does Ofsted Measure Schools or Postcodes
An analysis of 14,000 inspection outcomes across England's Primary and Secondary schools, matched to school census data on deprivation, ethnicity, and school type.
Ofsted's job is to tell us which schools are good. But how much of an inspection outcome is about the school - and how much is about the community it serves?
That question has shadowed the inspection system for decades. Schools in deprived areas consistently receive worse ratings than schools in affluent ones. The official line is that inspectors assess how well a school is doing with its pupils, not the pupils themselves. The data suggests the reality is more complicated - and under England's new report card system, the gap between deprived and affluent schools is wider than ever.
The Old Framework: A Real but Contained Gradient
Between 2022 and 2025, Ofsted carried out around 13,000 full inspections of Primary and Secondary schools in England under its outgoing four-point framework - Outstanding, Good, Requires Improvement, Inadequate.
Match those inspection outcomes to schools' free school meals eligibility rates and a clear gradient emerges:
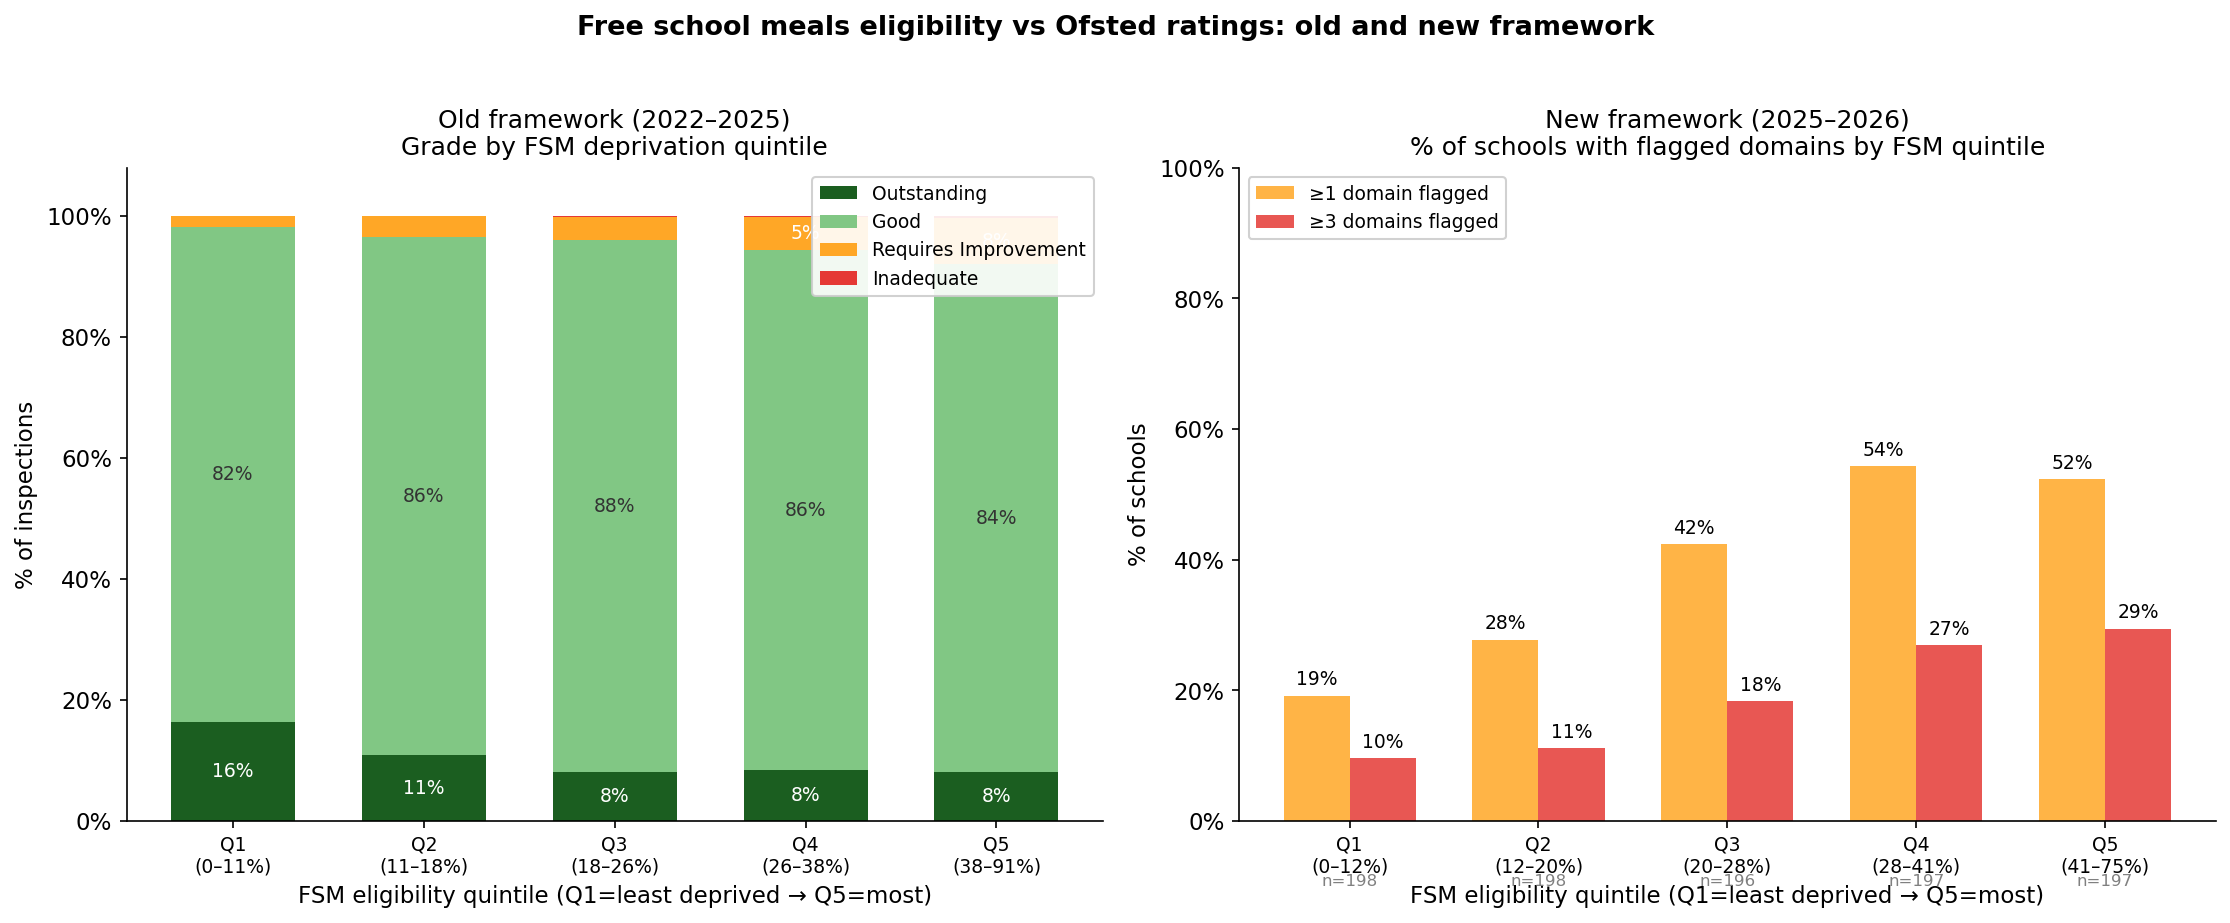
| FSM quintile | Eligibility range | % RI or Inadequate |
|---|---|---|
| Q1 (least deprived) | 0–11% | 1.8% |
| Q2 | 11–18% | 3.5% |
| Q3 | 18–26% | 4.0% |
| Q4 | 26–39% | 5.6% |
| Q5 (most deprived) | 39–91% | 8.0% |
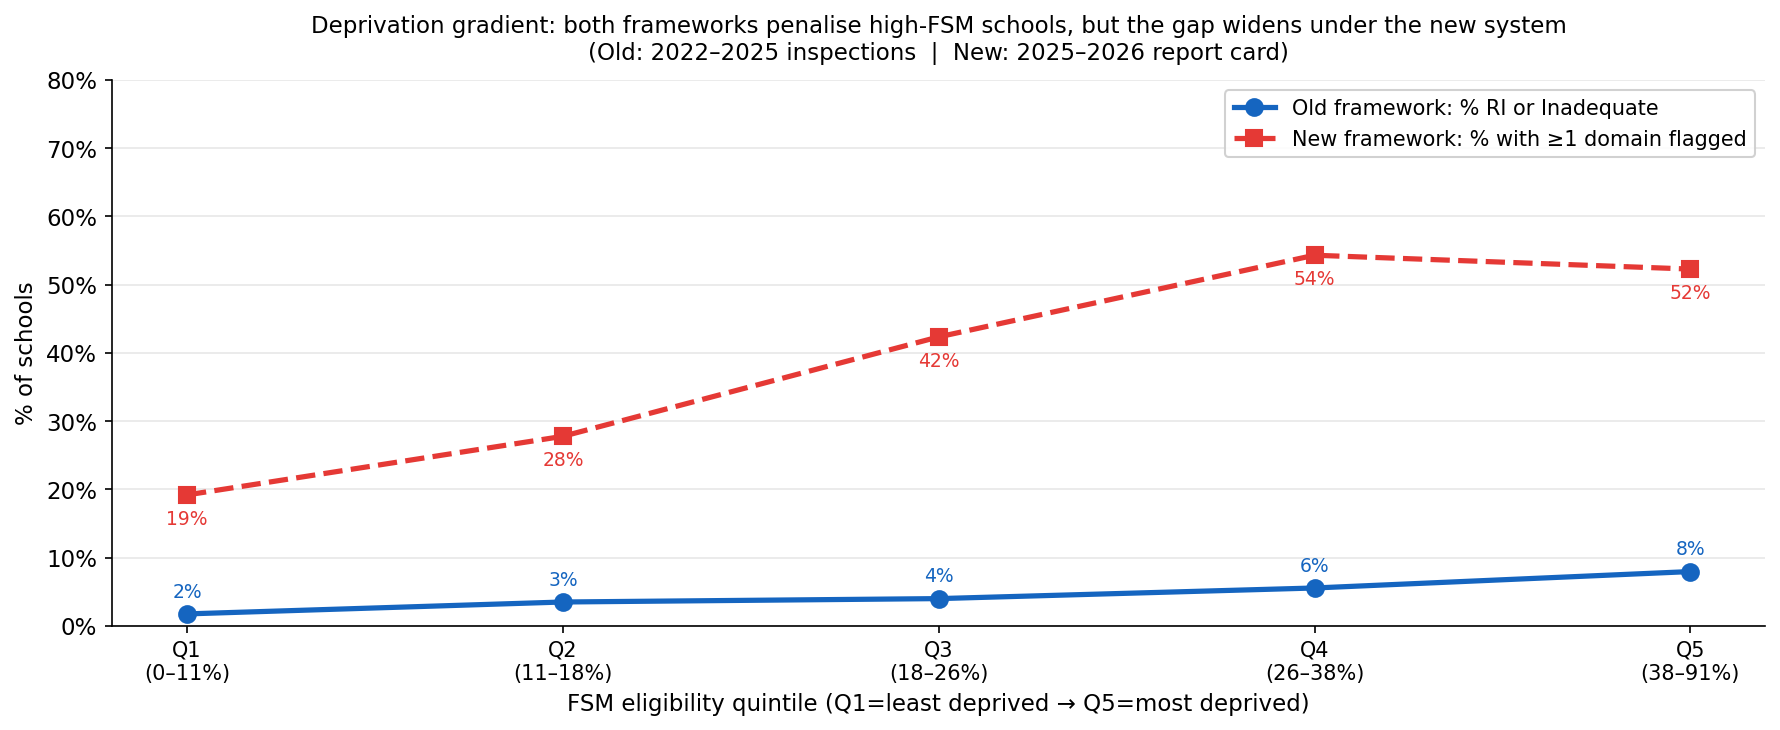
The most deprived schools were around 4× more likely to receive a poor rating than the least deprived. The pattern is consistent, and the gap is real. But in absolute terms, even the most deprived schools were overwhelmingly rated Good or Outstanding - only one in twelve fell below.
The Outstanding gap is also visible from the other end: schools in the least deprived quintile were twice as likely to receive Outstanding (16.4%) as those in the most deprived (8.1%).
The New Framework: A Much Steeper Cliff
In late 2025, Ofsted began rolling out its new "report card" system. Instead of a single overall grade, schools now receive separate ratings across six domains on a five-point scale: Exceptional, Strong standard, Expected standard, Needs attention, Urgent improvement.
Among the 986 Primary and Secondary schools inspected so far, the same FSM analysis produces a strikingly different picture:
| FSM quintile | % with ≥1 domain flagged |
|---|---|
| Q1 (least deprived) | 19% |
| Q2 | 28% |
| Q3 | 42% |
| Q4 | 54% |
| Q5 (most deprived) | 52% |
More than half of the most deprived schools have at least one domain rated Needs attention or worse. Among the least deprived, fewer than one in five.
Two important caveats. First, this is early data - 986 schools is a small, non-random sample, and the initial inspection cohort may skew towards schools overdue a visit. Second, "≥1 domain flagged" and "RI or Inadequate" are not equivalent thresholds; the subdomain structure of the new system naturally produces more flags. A direct comparison of scale is not valid.
What is valid is the direction and steepness of the gradient - and it has widened considerably.
Which Domains Are Driving the Penalty?
The new framework's granularity lets us ask a more precise question: which inspection criteria are most sensitive to a school's context, and which are most sensitive to what the school itself is doing?
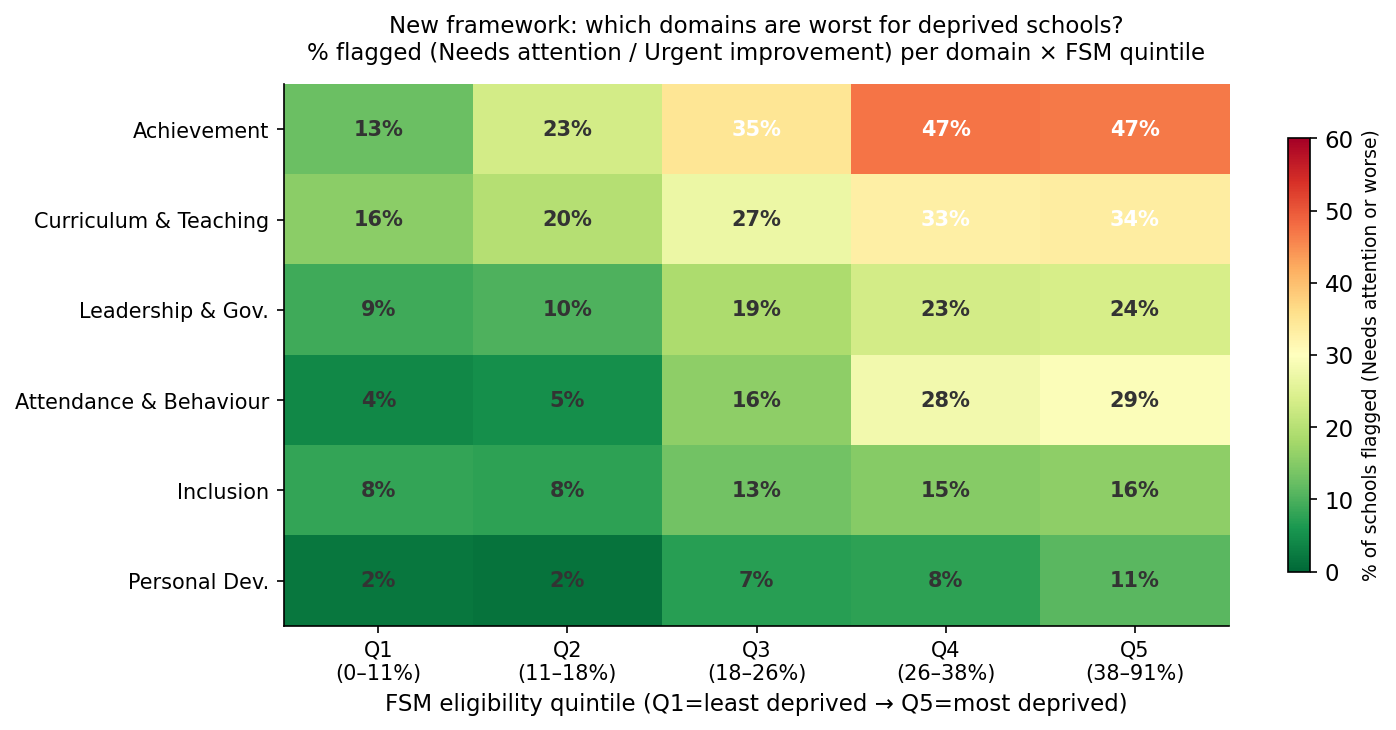
| Domain | Q1 flagged | Q5 flagged | Ratio |
|---|---|---|---|
| Attendance & Behaviour | 4% | 29% | 7× |
| Personal Development | 2% | 11% | 5.5× |
| Achievement | 13% | 47% | 3.6× |
| Leadership & Governance | 9% | 24% | 2.7× |
| Curriculum & Teaching | 16% | 34% | 2.1× |
| Inclusion | 8% | 16% | 2.0× |
The Attendance & Behaviour domain is by far the most deprivation-sensitive. Schools in the most deprived quintile are nearly eight times more likely to be flagged here than schools in the least deprived.
This is the most politically contentious finding in the data. Chronic absence rates are closely tied to poverty - families in financial crisis, children acting as young carers, housing instability, poor health. These are not problems a headteacher can solve in a staff meeting. If Attendance & Behaviour is being graded independently of a school's efforts and resources, and if those grades then define the public narrative about whether a school is struggling, the inspection system is in part measuring disadvantage and calling it performance.
Achievement shows a similar but less extreme gradient (3.6×). Post-pandemic learning recovery has been uneven, and the gap is widest in high-deprivation communities - a well-documented effect that predates Ofsted's new framework.
The least deprivation-sensitive domains - Inclusion and Curriculum & Teaching - are arguably the ones most directly under a school's control.
Faith Schools, Academies, and the Intake Effect
One of the most persistent patterns in Ofsted data is that faith schools and academies consistently outperform LA-maintained schools.
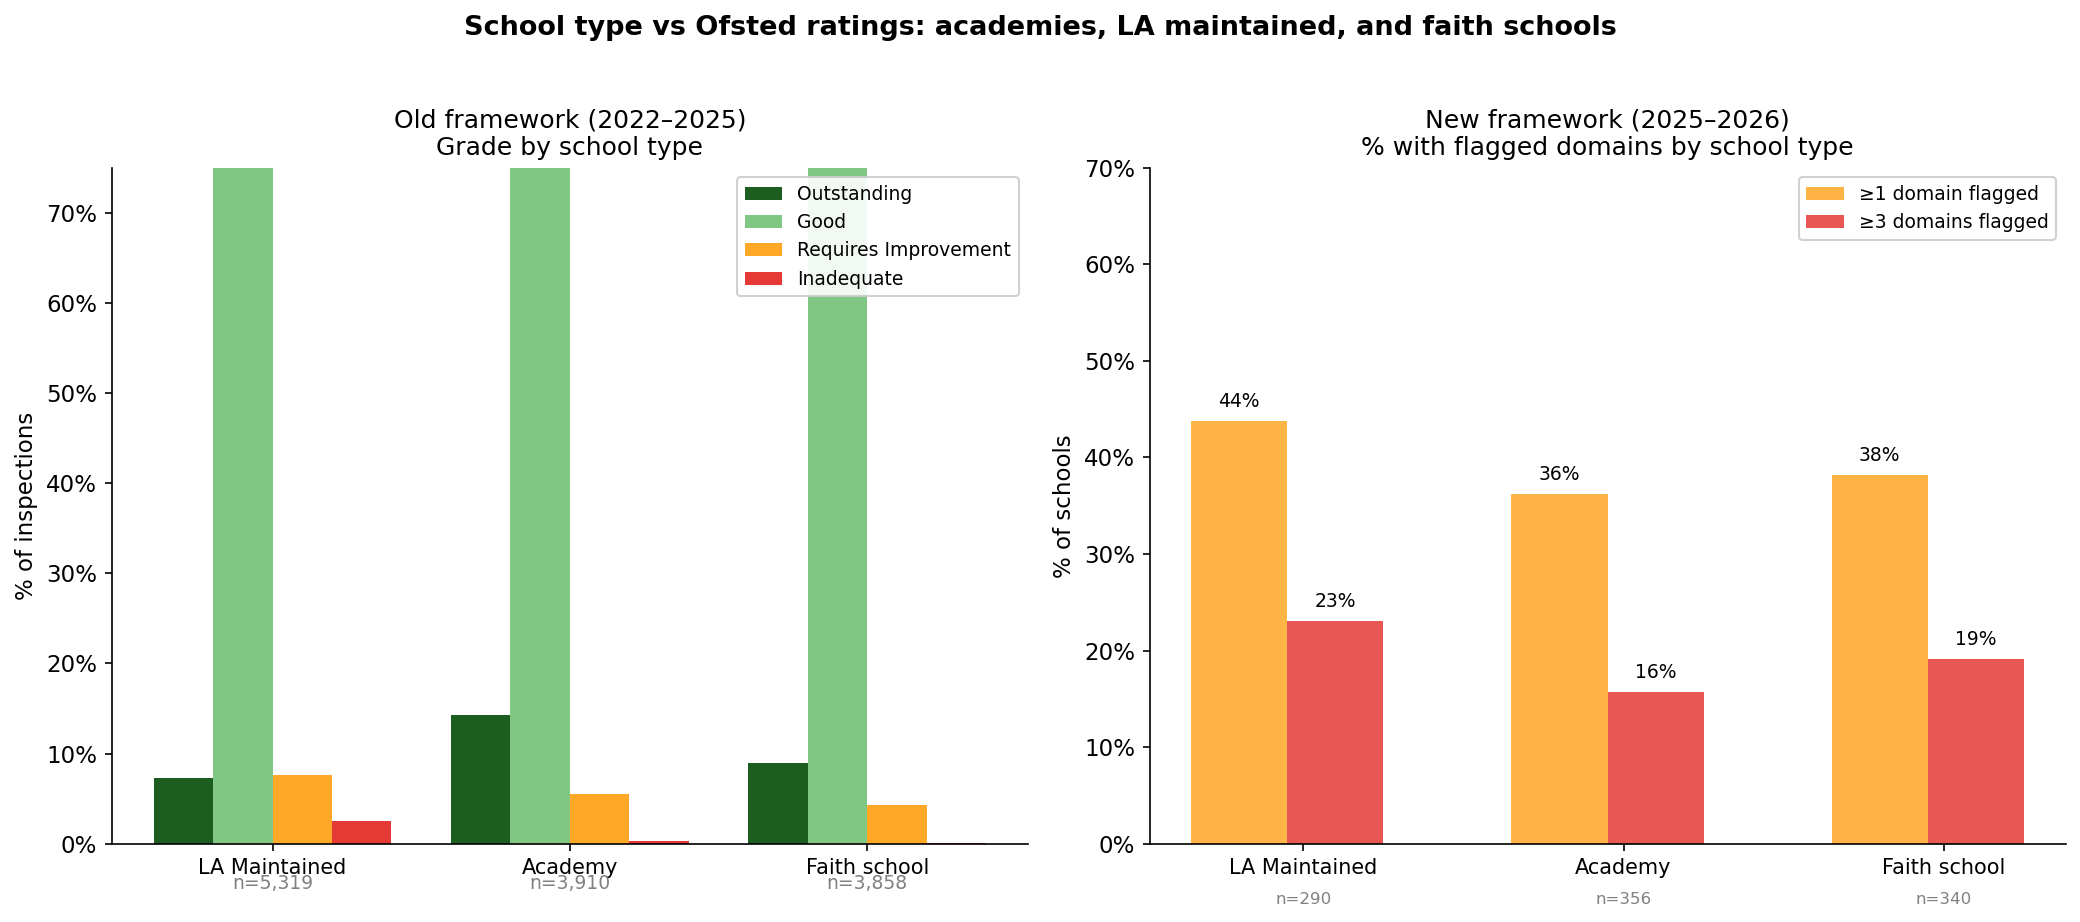
Under the old framework (2022–2025), the hierarchy was stark:
| School type | % RI or Inadequate | Avg FSM eligibility |
|---|---|---|
| Faith school | 4.3% | 21.3% |
| Academy | 5.8% | 27.0% |
| LA Maintained | 10.2% | 23.3% |
Faith schools' advantage is partly explained by their intake: they serve less deprived communities on average (21% FSM vs 27% for academies, 23% for LA-maintained). But academies - which actually serve more deprived communities on average than LA-maintained schools - still outperform them by a wide margin. That gap is less easily explained by intake, and may reflect genuine differences in management, structure, or the type of school that converts to academy status.
Under the new framework, the picture changes. The faith school advantage almost entirely disappears (38.2% flagged vs 39.6% for non-faith schools). Academies retain a more modest edge over LA-maintained (36% vs 44%). When inspectors look at six granular domains rather than one holistic grade, the advantages that accrue to selective or semi-selective intakes seem to matter less.
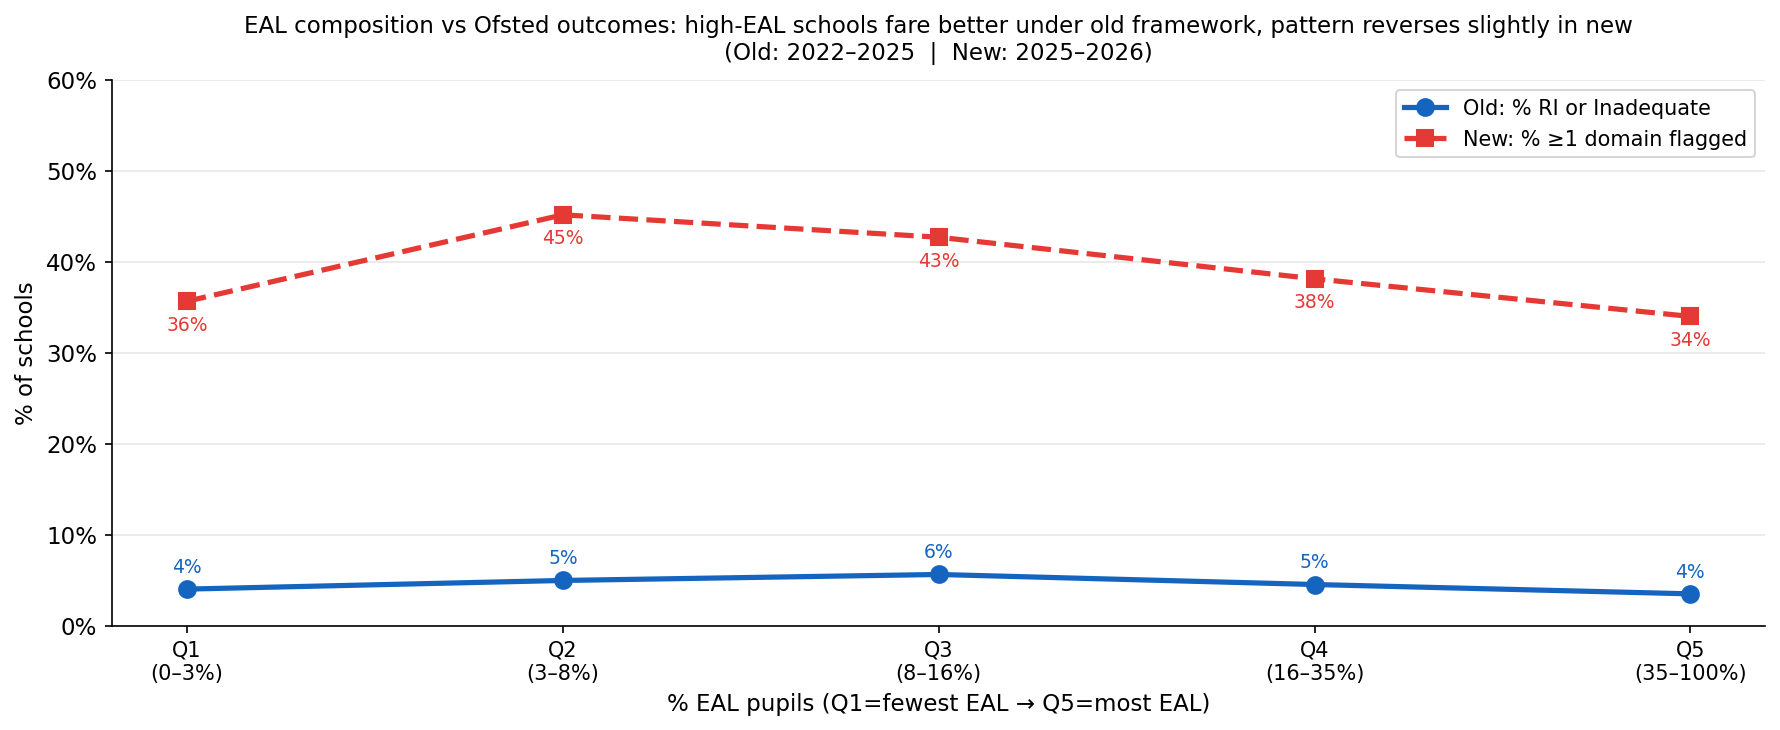
EAL Schools: The Dog That Didn't Bark
One finding worth highlighting for what it doesn't show: schools with large numbers of English as an Additional Language pupils show almost no disadvantage under either inspection system.
Under the old framework, the highest-EAL schools (where 35–100% of pupils speak a first language other than English) were actually less likely to receive a poor grade (3.5% RI/Inadequate) than schools with almost no EAL pupils (4.0%). Under the new framework, the relationship is similarly flat.
This is a meaningful absence. High-EAL schools are disproportionately urban, often serve recent immigrant communities, and face genuine challenges around language support. Yet their inspection outcomes are consistently at or above the national average. The most likely explanation is a combination of strong parental investment in education and concentration in cities where schools have well-developed EAL provision. Either way, it is not a group the data identifies as disadvantaged by the inspection system.
What This Means
The deprivation gradient in Ofsted outcomes is not new, and it is not unique to England. Every country that runs a national inspection system finds some version of this pattern. The question is what to do with it.
There are two sharply different interpretations of the steepening gradient under the new report card.
Interpretation one: the new system is more honest. The old four-point scale compressed a lot of variation into "Good," allowing schools with real weaknesses to hide behind an adequate overall grade. Six granular domains surface problems that were previously invisible. The fact that more deprived schools have more domains flagged may simply mean that inspectors are now finding and naming the challenges that were always there.
Interpretation two: the new system structurally penalises context. A domain like Attendance & Behaviour is not purely a measure of school quality - it is heavily shaped by the poverty, mental health pressures, and family instability that many high-FSM schools face. Grading it on the same scale as schools serving more affluent communities, without adjustment, does not measure school performance; it measures school context and calls it performance.
The data cannot resolve this debate. It can only make the scale of the gradient legible - and raise the question of whether a system where more than half of England's most deprived schools are flagged on at least one domain is measuring what it claims to measure.
Analysis based on Ofsted inspection events data (2022–2026) matched to DfE school census data. Covers Primary and Secondary schools only. Old framework analysis: 13,087 inspections (2022–2025). New framework analysis: 986 reports published to May 2026.